Riding The Gravy Train: April 2013

Riding The Gravy Train

Beating the market is fun and profitable. This is how we do it.

Sunday, April 28, 2013

Update On U.S. Treasuries Breaking Points, Impending Equities Dump


Today's post is an update of the ideas and charts presented in a recent post titled "Update: European Equities & U.S. Treasuries Breaking Points". 

Below is an updated chart.  What does it reveal?  We see uptrends being established, and as history shows these trends tend to last awhile.  If you correlate to a chart of the general equities market, you'll quickly notice that each time an uptrend in these charts has established itself a significant drop in equities happens. 


With that concern prevalent, we'll update our over/under lines for 2013:

DJIA 14550, way up from 13000.

GS above $137 bullish, below bearish, below $125 extremely bearish. Up from $112 and $100 respectively.

AAPL remains at $500.

It's worth noting that the AAPL over/under line was already broken by mid-January, after which it went on to lose a further and massive 23% over the next three months despite the overall equities market going higher virtually daily. 

When key trends or levels of support and resistance are broken, such as when mining shares (see "A Bear Market In Gold Miners" dated February 18, read at least the last paragraph with the oft-repeated "no one could have seen it coming" lie in mind) and silver (see "Silver Update..." dated March 07) violated respective long-term uptrends and then 52-week lows (more on this concept at the end of "Clutching At Straws, Still Drowning")  ... well you surely know what happened.


Key takeaway here:  What happened in gold and silver recently can, and certainly will happen in equities eventually.  Again.  History repeats. 

The only variation may be who gets stuck holding the bag, but that too very seldom varies.  That's worth keeping in mind if you're among the vast majority of bag holders who insist on continuing to participate in equities and commodities markets.  Shame, anger, blame and conspiracy theories won't save you, however getting a clue and acting accordingly might. 


We receive no remuneration or incentive directly or indirectly in any way, shape, or form for buying or selling the positions we do, or for mentioning any positions or companies in this blog. If we hold existing positions we divulge the fact. This blog is merely a diary of some of our thoughts and trades and is in no way whatsoever to be considered investment advice of any kind. Always without fail consult a competent, experienced, and honest broker or investment advisor before making any investment or speculative decisions.

Please presume that we, she, he, I, it, them, they, us and you are purely fictional characters and that everything written in this blog is satire intended for comedic amusement only and not to be taken seriously in any way. Just like "real" analyst proclamations. Thank you.


To be notified when this blog is updated : Please e-mail christianguinness@hotmail.com with "Subscribe to blog" in the subject line or click here to do so automatically if your computer is configured accordingly. We have never shared our mailing list with anyone, nor will we. Please note that we only send update notifications when a trade idea is diarized or updated, not if a blog entry only contains general commentary.


Wednesday, April 24, 2013

Lots Of Leverage Left To Unwind


The very weak bounce in gold and silver increasingly suggests at least one more leg down in the near term, probably in conjunction with equities, before a significant bounce occurs.

We've often noted the extreme amount of leverage being used lately by equities and precious metals longs, and consumers in general.


It's instructive to further note that the recent collapse in gold and silver coincided exactly with the biggest, albeit still very minor, equities market slide so far this year.


The charts above also prove correct our ongoing prediction, going back to 2011, that precious metals would lag equities.  In fact, "lag" is an understatement.  Gold touts rushed to show charts of the DJIA as priced in gold in the past, but surely haven't done so recently.  And let's please not pretend that gains years ago make the recent huge losses OK.  "Paper losses" are real losses no matter what you call them.

It's hard to say how much leverage was unwound in the recent drop, and we suspect not much.  In any case, clearly investors and speculators alike chose to sell the grossly underperforming metals when the margin calls came in.

Imagine what happens when there's finally a 3-day or 3-week drop in equities? 


We receive no remuneration or incentive directly or indirectly in any way, shape, or form for buying or selling the positions we do, or for mentioning any positions or companies in this blog. If we hold existing positions we divulge the fact. This blog is merely a diary of some of our thoughts and trades and is in no way whatsoever to be considered investment advice of any kind. Always without fail consult a competent, experienced, and honest broker or investment advisor before making any investment or speculative decisions.

Please presume that we, she, he, I, it, them, they, us and you are purely fictional characters and that everything written in this blog is satire intended for comedic amusement only and not to be taken seriously in any way. Just like "real" analyst proclamations. Thank you.


To be notified when this blog is updated : Please e-mail christianguinness@hotmail.com with "Subscribe to blog" in the subject line or click here to do so automatically if your computer is configured accordingly. We have never shared our mailing list with anyone, nor will we. Please note that we only send update notifications when a trade idea is diarized or updated, not if a blog entry only contains general commentary.


Monday, April 22, 2013

Clutching At Straws, Still Drowning


Some will not like the tone of this post, or of most of this blog.  We don't make any apologies for it.  We see it as the best way to get through to people who most need to get the message.  If instead we repeat the same rose-coloured rubbish available everywhere else, it is a waste of our time and yours. 

The largest amount of mail comes in to us after a market storm.  After the recent gold plunge, the usual trickling stream of doubt and derision changed to a steadier flow of "I'm in trouble, what do I do now?" and a few along the lines of "thank you, your blog saved/made me a lot of money."

Those in trouble, in some cases have lost significant personal wealth and even retirement funds. 

Retirement monies should never be put at any market risk.  That most certainly and especially includes ultra-volatile and unstable equities such as those relating to mining.  More simply, never think your money is safe if you're invested in something that has the investment world buzzing. 

To those wondering what to do next, we give the same reply: "1. Don't lose money, and 2. Don't risk more than you can afford to lose.  It's not too late for #2."

In today's post we'll expand on that, and assess the risk.  First the reader must put in some effort to truly understand that cycles happen, with illogical swings up and down, no matter what you think or want the facts or fundamentals to be.  A good primer is to read the posts from the past three months in this blog.

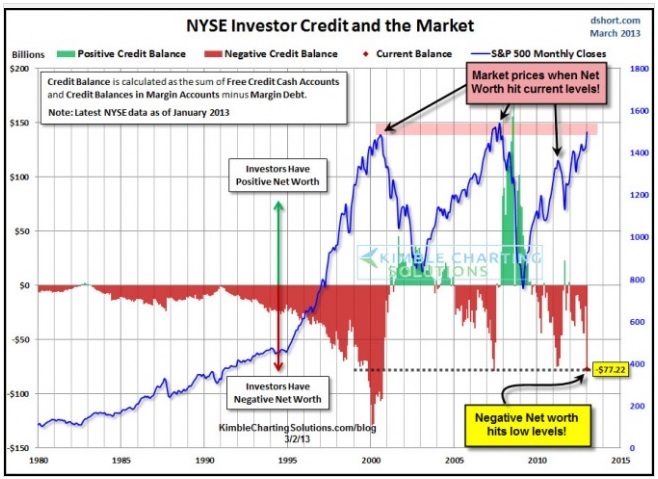
Precious metals holders are almost certainly on the wrong side of the peak shown here:


Those rushing to dismiss it as "just an opinion" should be reminded of this first - the chart above is not a chart depicting opinion, it is a chart depicting the sad fact of human nature repeated time and again for centuries and not just in speculations. 

The above chart is all that matters, because human nature is all that matters not wild conspiracy theories, waiting for a "final blow-off" (arguably happened in 2011), make-believe accountings of how much gold the U.S. holds, or silly ideas that only "paper" gold has gone down or simply that it's different this time.  In fact, history repeats. 

The same spewage [sic] that resulted in many portfolios now being destroyed doesn't matter either.  Surely you're tired of hearing "buy the dips" or "miners are cheap" by now?  If not, how many more losses will it take?  When will you realize those same touts said the same thing all the way down in every other bubble of the past dozen years, and there have been many touts and bubbles.

Sadly, many reading this have been through it all before.  Perhaps with real estate, rare earths, oil, uranium, tech stocks, etc. etc.  Those who blame others, and make or propagate wild excuses, will repeat the cycle again.  They don't take responsibility and they trust the same broker or newsletter that urged them to rush to buy, or keep buying, at the top.  It makes no sense, but in fear and panic people will thrash about clutching at straws while still drowning ... in red ink.

Consider this - did those sources ever offer an exit strategy, and did they ever even suggest the things we've been repeating in this blog about manias?  No, because they really have no idea how to make money in investing or speculating.  That's why they're brokers (salesmen) or publishing newsletters for a living.  They tell you that "no one could see this coming",  yet we've been correct all along.  Sometimes you don't get what you pay for. 

There are some good ones out there - brokers and newsletters - but you probably don't have access to them.  Anyone taking your calls, much less calling you with an investment idea, probably isn't getting rich in the market are they?  They're probably not rotting in a cubicle at 5:30 AM getting ready to make the day's cold calls, or manning a sales or "investor relations" booth down some dusty corridor of an "investment conference", if they can reliably score in the market.

Fact is though, that even the very best make mistakes.  The most storied and successful investors or speculators have caused, or will cause, portfolios to implode.  Just look at some of the household names and rock-star hedge fund managers who were long gold while it plunged.  They probably aren't "all in" though, but if they were then their names will soon be forgotten and mocked.  Most will survive and come back, as they are first and foremost professional hustlers & hucksters with plenty of contacts in the business and much of their income comes from fees and commissions.  You will probably not land as softly. 

Along the theme of even the best making grave errors at times, may we suggest reading some books on mountaineering?  "Into Thin Air" is a excellent and highly entertaining one.  True story, hard to put down and you'll never forget it.  By contrast this book is dry but perfectly apropos, "Extraordinary Popular Delusions and the Madness of Crowds", especially the first 100 pages.  These books are virtually all you need to understand markets and manias.  No scholastic degree or hotline to the head of Goldman Sachs will help you more than getting a grip on human nature. 

Let's go with the mountaineering analogy for now.  Most climbers get to the top, and most accidents happen on the way down.  Of course some of those accidents are crippling or fatal.  The chart above is the mountain, and when you're at the peak with your biggest holding all over the front pages and broadcasts of outlets not even related to investing, as were gold and silver, then your time at the peak is limited and it's all downhill from there.  Descents happen faster than ascents, and they're perilous.

The expedition guide is your broker, newsletter or blog of choice.  Is that a rookie giving you life-or-death advice, someone who's never even been up the peak?  If he's been up there, did he learn anything?  Has she even got a history of safe expeditions, ever guided on a successful team that made it back from a peak with everyone and everything intact?  Has he warned you about the risks and given you clear instructions in case the regular happens - avalanche of snow or of sellers, stormy skies or markets, etc.  The analogies are endless and we'll leave you to discover that, if you prefer awareness and understanding to ignorance and repeating costly mistakes. 

Assessing the current risk, we repeat that a bounce is due in gold and silver but there's a good chance of one more leg down before any material bounce.  It could be a small drop, or massive with the resulting bounce not even making it back to today's levels.  If you're not already a successful trader/speculator over many cycles, do not even think about trying to time the bounce if there is one.  Anyone who tells you otherwise is irresponsible and reckless, and probably doesn't make their living via trading.

We can't see the future, but we can know the past.  In addition to market and human history, you must know your own past.  If you were long to begin with, and didn't sell before or during the plunge, and if you've been through all this before, probably dragging family and friends into it who are now at a loss, and following the same advice that led you down the loss column, do you really think you'll sell at the peak of a bounce? 

Unless you change your approach to speculating (and that's exactly what it is if you're in gold and silver or related holdings such as mining shares), or exit the market entirely realizing it is not a place for you and your money, then even if you make some or all of the losses back you'll just lose that much and more down the road perhaps in the very next bubble with the same pattern and touts as this one. 

There is some hope that gold and silver go much higher in time, possibly reaching new highs, though the chances are very low and if we had to put a percentage figure on it we'd be extremely generous in calling it 5%.  Long before that happens though, we'll probably be long and will announce that in advance here.

If we were holding un-hedged related issues now, we'd sell and wait for a buy signal if we must get back in.  Could be next month or in 5 years.  Who knows?  And more importantly, why care?  The process, the discipline, of a reliably successful method and sources which accurately account for human nature and fear-greed cycles, is all that matters.

How many of these "10 Steps To Building A Winning Trading Plan" did you forgo?  What about "The Importance Of Trading Psychology And Discipline"?  Or these "10 Timeless Rules For Investors"?  If you've been long gold, silver or mining shares over the past few months the answer is probably "all of them".

While by law we cannot give individual investment advice to those who write us, we can and have certainly and repeatedly for years provided the tools necessary to "get it".  For free!  With respect we urge everyone, whether long or short, in the black or red, to self-assess and consider the rules and the facts as shown by human history and your own past, then do what feels right. 

If you're anxious, sleepless, angry, arguing online, bragging, ego hurting, sending nasty emails, desperate, or anything of the kind, you're incorrectly positioned. 

In closing, here's the simplest rule-of-thumb of all: Never hold or buy anything making a 52-week low. You can find that information for free easily.  The worst of the investor losses in virtually every bubble and bankruptcy ever would've been avoided if that simple rule were followed. 

As we often write, it's not different this time.  Both gold and silver recently collapsed after hitting their respective 52-week lows.


We receive no remuneration or incentive directly or indirectly in any way, shape, or form for buying or selling the positions we do, or for mentioning any positions or companies in this blog. If we hold existing positions we divulge the fact. This blog is merely a diary of some of our thoughts and trades and is in no way whatsoever to be considered investment advice of any kind. Always without fail consult a competent, experienced, and honest broker or investment advisor before making any investment or speculative decisions.

Please presume that we, she, he, I, it, them, they, us and you are purely fictional characters and that everything written in this blog is satire intended for comedic amusement only and not to be taken seriously in any way. Just like "real" analyst proclamations. Thank you.


To be notified when this blog is updated : Please e-mail christianguinness@hotmail.com with "Subscribe to blog" in the subject line or click here to do so automatically if your computer is configured accordingly. We have never shared our mailing list with anyone, nor will we. Please note that we only send update notifications when a trade idea is diarized or updated, not if a blog entry only contains general commentary.


Friday, April 19, 2013

Update on NASDAQ, Gold, Silver & U.S. Dollar


With only seven trading days left in April we've yet to have a 3-day decline in the DJIA in 2013, however soon enough there'll be a 3-day and 3-week decline.  3 month?

In this recent post, "Update on Key Trends Soon To Be Broken, Plus Bitcoin Chart", we wrote that the NASDAQ would soon break its uptrend.  Two days later, that's happened and the DJIA and S&P should soon follow suit:


Gold and silver failed to bounce materially after collapsing early in the week, which suggests that the proverbial knife-catchers trying to time a bounce may suffer further cuts before a true bounce begins.  Whatever the short-term brings, any moves higher in gold and silver should eventually prove to be just bounces on the long way much further down.


On March 03 we posted "U.S. Dollar Going Higher, Gold Going Lower?"  In closing that post, we wrote:

"We believe the next two years will feel like an eternity for those who continue to slag the dollar and accumulate gold and silver in a misguided attempt to 'buy the dips'."

Readers of this blog do not need to see a chart to know how timely and accurate that statement has proven so far, and so too the correctness of our bearish stance on gold and silver of the past couple years which we've repeated stridently the past few months. 


Here's an update of the UUP chart:


On the USD chart, we see that the expected breakout seems to have occurred. The implication is that the dollar will continue to climb while commodities and equities slide:


We receive no remuneration or incentive directly or indirectly in any way, shape, or form for buying or selling the positions we do, or for mentioning any positions or companies in this blog. If we hold existing positions we divulge the fact. This blog is merely a diary of some of our thoughts and trades and is in no way whatsoever to be considered investment advice of any kind. Always without fail consult a competent, experienced, and honest broker or investment advisor before making any investment or speculative decisions.

Please presume that we, she, he, I, it, them, they, us and you are purely fictional characters and that everything written in this blog is satire intended for comedic amusement only and not to be taken seriously in any way. Just like "real" analyst proclamations. Thank you.


To be notified when this blog is updated : Please e-mail christianguinness@hotmail.com with "Subscribe to blog" in the subject line or click here to do so automatically if your computer is configured accordingly. We have never shared our mailing list with anyone, nor will we. Please note that we only send update notifications when a trade idea is diarized or updated, not if a blog entry only contains general commentary.


Thursday, April 18, 2013

The Psychology Of Gold And Silver Investing (Seven Stages Of Grief)


Having enjoyed this bit of fact and the mention of the stages of grief therein - Academic Study From Last Year Shows Gold's Fair Value is $800 -  today we update our graphic which shows where gold and silver bulls fall on the scale of the "Seven Stages Of Grief".

First a review of December 2011 and May 2012:


Now here's how it looks in April of 2013:


We note with interest and confirmation that the tone of the (hate) mail we receive from precious metals bulls has mirrored these stages all along the way.

Another way to look at it, from this recent post "A Normal Week In Gold, Silver and Bitcoin":


As the graphic above shows, the mean tends to be exceeded on the down side when a bubble pops, so if $800 is indeed fair value for gold then it'd be perfectly normal to see prices as low as $600 before it's all said and done.  No market manipulation or conspiracy required, just history repeating.


We receive no remuneration or incentive directly or indirectly in any way, shape, or form for buying or selling the positions we do, or for mentioning any positions or companies in this blog. If we hold existing positions we divulge the fact. This blog is merely a diary of some of our thoughts and trades and is in no way whatsoever to be considered investment advice of any kind. Always without fail consult a competent, experienced, and honest broker or investment advisor before making any investment or speculative decisions.

Please presume that we, she, he, I, it, them, they, us and you are purely fictional characters and that everything written in this blog is satire intended for comedic amusement only and not to be taken seriously in any way. Just like "real" analyst proclamations. Thank you.


To be notified when this blog is updated : Please e-mail christianguinness@hotmail.com with "Subscribe to blog" in the subject line or click here to do so automatically if your computer is configured accordingly. We have never shared our mailing list with anyone, nor will we. Please note that we only send update notifications when a trade idea is diarized or updated, not if a blog entry only contains general commentary.


Copper Comes A Cropper


"Comes a cropper" means "to have a misfortune, to fail, to fall to the ground."


Related:

March 01 - "Doctor" Copper Offers A Dire Diagnosis

March 18 - Cyprus Is Immaterial and Dr. Copper Is Still Unhappy


We receive no remuneration or incentive directly or indirectly in any way, shape, or form for buying or selling the positions we do, or for mentioning any positions or companies in this blog. If we hold existing positions we divulge the fact. This blog is merely a diary of some of our thoughts and trades and is in no way whatsoever to be considered investment advice of any kind. Always without fail consult a competent, experienced, and honest broker or investment advisor before making any investment or speculative decisions.

Please presume that we, she, he, I, it, them, they, us and you are purely fictional characters and that everything written in this blog is satire intended for comedic amusement only and not to be taken seriously in any way. Just like "real" analyst proclamations. Thank you.


To be notified when this blog is updated : Please e-mail christianguinness@hotmail.com with "Subscribe to blog" in the subject line or click here to do so automatically if your computer is configured accordingly. We have never shared our mailing list with anyone, nor will we. Please note that we only send update notifications when a trade idea is diarized or updated, not if a blog entry only contains general commentary.


Wednesday, April 17, 2013

Update on Key Trends Soon To Be Broken, Plus Bitcoin Chart


On April 02 we presented "Key Trends Soon To Be Broken: Russell 2000 - Small Caps Index, DJT - Dow Jones Transportation Average, Silver", and today we follow up on those charts.

Obviously silver did indeed break down, to say the least.  Check.

Dow Jones Transportation Average.  Check:


Russell 200 Small Caps Index.  Check:


NASDAQ.  Soon:


Today we'll add two charts to the mix which should also soon break down. 

First, the Dow Jones Industrials:


And the S&P500:


Smile? Check :)


We receive no remuneration or incentive directly or indirectly in any way, shape, or form for buying or selling the positions we do, or for mentioning any positions or companies in this blog. If we hold existing positions we divulge the fact. This blog is merely a diary of some of our thoughts and trades and is in no way whatsoever to be considered investment advice of any kind. Always without fail consult a competent, experienced, and honest broker or investment advisor before making any investment or speculative decisions.

Please presume that we, she, he, I, it, them, they, us and you are purely fictional characters and that everything written in this blog is satire intended for comedic amusement only and not to be taken seriously in any way. Just like "real" analyst proclamations. Thank you.


To be notified when this blog is updated : Please e-mail christianguinness@hotmail.com with "Subscribe to blog" in the subject line or click here to do so automatically if your computer is configured accordingly. We have never shared our mailing list with anyone, nor will we. Please note that we only send update notifications when a trade idea is diarized or updated, not if a blog entry only contains general commentary.


Tuesday, April 16, 2013

A Normal Week In Gold, Silver and Bitcoin


There's much chatter about the past couple days of trading in gold and silver.  This gold chart explains why (a silver chart would look essentially identical):


However these are the charts that should've set people off, which we posted on February 20.  In that post we stated: "We remain long-term very bearish on gold and silver.  The breaking point may be imminent."

And the panic selling should've happened in early March, per this Silver Study.

Even though we predicted it, many will wonder how we dare to call the recent action in gold and silver "normal"?  Because it is. 

Recall tech stocks, uranium, rare earths, real estate, oil many times, gold and silver 30 years ago, even Beanie Babies, the career path of New Kids On The Block, or any other mania you wish.  They all look like this:


The creator of that graphic is unknown to us, however what we do know is that it didn't take a genius to create it because this is a very common pattern.  A Bitcoin chart of the past month also looks exactly like it, as Bitcoin is down 45% from this morning and down about 70% from last week. 

That familiar pattern is what lead us to state in this post from February 18th: "Sooner or later there will be a proverbial stampede for the exits and shares in gold-related ETF's, along with their physical holdings, will be dumped hard and fast.  At that time, something like this past week's big plunge in gold and gold miners will be looked back upon fondly as the good old days."

That familiar pattern is also what led us to state in this post from September of 2011: "We feel completely certain that the silver bull market is over for a very long time to come, and quite possibly gold has topped too. "

Experience helps too, as does some common-sense.  And certainly we're not the only ones to get it right.  Credit where due.

The important take-away is that unless you learn about human nature and the natural cycle of fear & greed booms & busts, along with market history, you are doomed to buy at the top and sell at the bottom during every cycle. 

Perhaps you got in early, but borrowed to go "all in" at the top and coerced family and friends to do the same.  It's probably not the first time you've made this mistake and it's likely not the last unless you take responsibility and discard the ridiculous "massive short position" and conspiracy theories. 

This pattern is predictable and profitable.  Ignore these facts and be delusional to your continued detriment. 


We receive no remuneration or incentive directly or indirectly in any way, shape, or form for buying or selling the positions we do, or for mentioning any positions or companies in this blog. If we hold existing positions we divulge the fact. This blog is merely a diary of some of our thoughts and trades and is in no way whatsoever to be considered investment advice of any kind. Always without fail consult a competent, experienced, and honest broker or investment advisor before making any investment or speculative decisions.

Please presume that we, she, he, I, it, them, they, us and you are purely fictional characters and that everything written in this blog is satire intended for comedic amusement only and not to be taken seriously in any way. Just like "real" analyst proclamations. Thank you.


To be notified when this blog is updated : Please e-mail christianguinness@hotmail.com with "Subscribe to blog" in the subject line or click here to do so automatically if your computer is configured accordingly. We have never shared our mailing list with anyone, nor will we. Please note that we only send update notifications when a trade idea is diarized or updated, not if a blog entry only contains general commentary.


Sunday, April 14, 2013

Buying SJB to Short Junk Bonds


Market Note: The last time the RSI (Relative Strength Indicator) momentum measure for the DJIA was as high as today was in early April of 1999, after which the market moved sideways for two years then suffered a major 16-month crash.

SJB is the ProShares Short High Yield ETF, and here is its weekly chart:


A close above the green line will signal an opportunity to enjoy the enormous upside potential in shorting "junk" bonds. 

At some point, the long-running bull market in high-yield instruments will end and reverse in spectacular fashion.  This should coincide with a protracted drop in equities, resulting in the proper punishment for the extreme complacency currently exhibited by investors and speculators in stocks and bonds at current levels. 

We're buying SJB, last at $30.92 and utilizing a stop at $30 on a closing basis.


Readers of this blog should not be at all surprised about Friday's crash in gold and silver:


Those who heeded our warnings could've made a killing.


The  articles linked below may serve as contrary indicators, suggesting that after the recent sell-off a bounce is due. 

Cyprus may sell some gold reserves to help fund bailout.
Goldman Sachs Says It's Time to Short Gold
Japanese Rush to Sell Gold

We've covered most of our gold shorts for now (positions often mentioned but not diarized herein) and will remain short silver for the long haul (via ZSL as detailed previously in this blog).  There will be big bounces as gold and silver, and most commodities, go much lower over time. 


We receive no remuneration or incentive directly or indirectly in any way, shape, or form for buying or selling the positions we do, or for mentioning any positions or companies in this blog. If we hold existing positions we divulge the fact. This blog is merely a diary of some of our thoughts and trades and is in no way whatsoever to be considered investment advice of any kind. Always without fail consult a competent, experienced, and honest broker or investment advisor before making any investment or speculative decisions.

Please presume that we, she, he, I, it, them, they, us and you are purely fictional characters and that everything written in this blog is satire intended for comedic amusement only and not to be taken seriously in any way. Just like "real" analyst proclamations. Thank you.


To be notified when this blog is updated : Please e-mail christianguinness@hotmail.com with "Subscribe to blog" in the subject line or click here to do so automatically if your computer is configured accordingly. We have never shared our mailing list with anyone, nor will we. Please note that we only send update notifications when a trade idea is diarized or updated, not if a blog entry only contains general commentary.


Saturday, April 13, 2013

Update: European Equities & U.S. Treasuries Breaking Points


This is an update to the posting dated April 05, "European Equities, U.S. Treasuries, Japanese Equities, Yen and Stimulus".  Please see the charts therein for context.

We already find corroborating broken uptrends in both of the other major European markets:


We wrote that "another way to gauge when U.S. equities will drop is the U.S. 10-Year Treasury Note. A close above 133 should coincide with a bearish move in equities." 

To end that week the 10-Year Note popped well above the 133 level though it closed right on the line exactly at 133.  To end this past week it again closed exactly at 133, but apparently above a 9-month downtrend:


The 30-Year also has a key level we've been keeping an eye on, just over 146, which has been violated:


We receive no remuneration or incentive directly or indirectly in any way, shape, or form for buying or selling the positions we do, or for mentioning any positions or companies in this blog. If we hold existing positions we divulge the fact. This blog is merely a diary of some of our thoughts and trades and is in no way whatsoever to be considered investment advice of any kind. Always without fail consult a competent, experienced, and honest broker or investment advisor before making any investment or speculative decisions.

Please presume that we, she, he, I, it, them, they, us and you are purely fictional characters and that everything written in this blog is satire intended for comedic amusement only and not to be taken seriously in any way. Just like "real" analyst proclamations. Thank you.


To be notified when this blog is updated : Please e-mail christianguinness@hotmail.com with "Subscribe to blog" in the subject line or click here to do so automatically if your computer is configured accordingly. We have never shared our mailing list with anyone, nor will we. Please note that we only send update notifications when a trade idea is diarized or updated, not if a blog entry only contains general commentary.


Friday, April 12, 2013

Bitcoin - Be Careful What You Wish For

Bitcoin or, as some call it, Bitcon.

What is it?  Currency ... Ponzi ... scam ... gold for geeks?

Anonymous?  No.  The supposed security of Bitcoin is that each can be traced not only to the current owner but to all previous owners.  In that sense, it is the ultimate dream of fascists, police and tax collectors. 

This same security feature also necessitates a 10-minute wait, at minimum, before the authenticity of someone's Bitcoin can be verified.  That time will shorten in the future, if Bitcoin is still around, but imagine the implications for the business - does the customer have to wait 10 minutes before they can leave with their coffee paid for via Bitcoin, or does the business run the risk of being defrauded while allowing the customer to leave immediately with merchandise?  Many allege that Bitcoin is used for illegal transactions.  Do you stand around with a drug dealer on a corner waiting for verification?

Sure counterfeit cash exists, but millions of dollars worth can't be created at the click of a mouse.  Insert Central Bank snark here.  Some will argue that counterfeiting hasn't happened with Bitcoin, to which we reply "perhaps" and "not yet".

A greater risk for businesses is tax risk.  If you sell something for Bitcoin when it's worth $200 you owe taxes on your profit, but by the time you pay the taxes the Bitcoin may only be worth $5 and you eat the effective loss by having to pay the tax out-of-pocket with real currency. 

Sounds far-fetched, because Bitcoin is touted as being stable?  It's anything but stable. 

Consider that over the past two days the "value" of Bitcoin crashed 75%.  It would've happened faster, except the major Bitcoin exchanges crashed along with it.  Rather, they claim to have closed voluntarily for awhile to let the action cool. 

Upon re-opening, Mt.Gox - which handles 80% of Bitcoin trading - promptly went offline yet again.  A couple hours later, everything was finally back to normal. 

Wait ... "normal"?  Perhaps "unreliable" is a better term?  One might think so but the fact is that this is all very normal price action when a mania booms and busts, as long-time readers of this blog should know by now. 

Here's the chart:


That chart looks like every other parabolic greed-frenzy in history, and the ending will be the same.  The top was marked with the usual clues - Bitcoin was being discussed on all news programs, and the internet was full of stories such as the one about this kid trying to sell his family home for Bitcoin.

Human nature is constant with respect to fear and greed, as are the results.  Here's a longer-term look at it, in case the parabolic nature is not readily apparent in the chart above:


Keep in mind, it's had massive crashes before so this volatility is also arguably normal.  Today alone it opened around $80, popped to around $110 and was most recently around $60.

Some say it is the currency of freedom.  Is it not subject to restrictions?  Whatever it's "worth", can you at least reliably access your "money" even if the exchanges are down or the Bitcoin price is crashing?  Nope! 

One of the main touts is that Bitcoin is free of government oversight and intervention (for now), however per this notice at Mt.Gox you can see that turning Bitcoin into real cash has its own restrictions

At best it's currently a video game and likely that's all it ever will be until governments get involved as they'll be more than happy to be able to reliably track everything we earn or spend. So, fans of e-currency, especially all those who wished they'd put their life savings into Bitcoin over the past few weeks, be careful what you wish for. 


We receive no remuneration or incentive directly or indirectly in any way, shape, or form for buying or selling the positions we do, or for mentioning any positions or companies in this blog. If we hold existing positions we divulge the fact. This blog is merely a diary of some of our thoughts and trades and is in no way whatsoever to be considered investment advice of any kind. Always without fail consult a competent, experienced, and honest broker or investment advisor before making any investment or speculative decisions.

Please presume that we, she, he, I, it, them, they, us and you are purely fictional characters and that everything written in this blog is satire intended for comedic amusement only and not to be taken seriously in any way. Just like "real" analyst proclamations. Thank you.


To be notified when this blog is updated : Please e-mail christianguinness@hotmail.com with "Subscribe to blog" in the subject line or click here to do so automatically if your computer is configured accordingly. We have never shared our mailing list with anyone, nor will we. Please note that we only send update notifications when a trade idea is diarized or updated, not if a blog entry only contains general commentary.


Thursday, April 11, 2013

Shorting Commodities Via DEE (PowerShares DB Commodity Double Short ETN)


The chart below of DEE, the PowerShares DB Commodity Double Short ETN, suggests tremendous upside is possible while little downside remains in shorting commodities:


Disclaimer: We own DEE since mid-October, at an average cost of $26, not diarized herein.

Once the downtrend shown in green is broken, we'll probably be adding DEE.  Should closes occur below $24, which is beneath the uptrend in black, we'll definitely close our position. 


We receive no remuneration or incentive directly or indirectly in any way, shape, or form for buying or selling the positions we do, or for mentioning any positions or companies in this blog. If we hold existing positions we divulge the fact. This blog is merely a diary of some of our thoughts and trades and is in no way whatsoever to be considered investment advice of any kind. Always without fail consult a competent, experienced, and honest broker or investment advisor before making any investment or speculative decisions.

Please presume that we, she, he, I, it, them, they, us and you are purely fictional characters and that everything written in this blog is satire intended for comedic amusement only and not to be taken seriously in any way. Just like "real" analyst proclamations. Thank you.


To be notified when this blog is updated : Please e-mail christianguinness@hotmail.com with "Subscribe to blog" in the subject line or click here to do so automatically if your computer is configured accordingly. We have never shared our mailing list with anyone, nor will we. Please note that we only send update notifications when a trade idea is diarized or updated, not if a blog entry only contains general commentary.


Saturday, April 06, 2013

Technical Analysis - A Practical Example: LBS (Brompton Life Banc Split), Consumer Credit, "Sell In May"


Here's an example of how our form of technical analysis works, using LBS (Brompton Life Banc Split) as an example. 

First, please consider this short post from May 31 2012.  What happened after "gold's worst monthly run in over 11 years" and "terrible sentiment for equities"?  The rally we expected happened.  Why did we expect it?  Because the world was bearish, especially on banks, so naturally we recommended a holding made up largely of bank shares noting "we believe it'll outperform gold in the long term if not the short term."

A few gold bugs wrote in with their usual outrage, insults and mockery, all predicting that equities would collapse (especially banks) and that gold would outperform considerably.  This was a widespread belief at the time, not just among hard-core gold bugs.

10 months later, what's actually happened?  After rising 14.5% gold is down to the same level as it was back then.  In stark contrast, LBS bottomed two days after we suggested it and two weeks ago was 50% higher than it was when we called it.  Plus it has paid out a whopping 15% (based on the price when we called it). 

As for banks in general, the market rally thus far was indeed "led by banks".  To name a couple, BAC (Bank of America) rose as much as 76% and GS (Goldman Sachs) 71%.  That's without factoring dividends. 

Now for the practical example of technical analysis.  Why did we turn bullish when we did?  In part purely because of our experience.  Its long-term chart reveals the rest of the answer:


You can see that at the end of May 2012, just before its lows of the past year, it was near the support suggested by the red uptrend line.  That line wasn't based on imagination, it had been clearly established by the 2009 and 2011 lows. 

If you hold it, when do you sell?  The news and "experts" were black-bearish all along, yet banks and global equities pushed higher.  In the case of LBS, it pushed all the way back to the established long-term downtrend in black.  It's important to note that at that point banking analysts were more bullish than they'd been for more than 5 years.  Readers of this blog know we've been bearish recently and warned of this turn via our GS studies

Here's another way to look at it, a closer look at LBS:


If the share price approaching the long-term downtrend shown in the first chart wasn't enough, then just below the break of the first uptrend in red shown in the chart above would have been a good place to set stops.  Once that line was broken, the shares went sideways until the next trend was broken, then the price plunged down to the blue line before trading and closing back above the black uptrend line. 

That blue line marks the price at which the mid-2012 rally stopped, and it's also the price at which the plunge in late-2012 stopped.  It's not at all uncommon that stocks behave this way, so for those looking to "buy the dips" having these lines in mind is also very helpful. 

No method is perfect, and this method is nowhere near as simple as we might make it seem, but that's why we present this blog to provoke thought and educate, and any method is better than guessing, delusions, or following the sheeple flock comprising of most investors, speculators, and so-called expert analysts.


With the "Consumer Debt Supernova" portion of this post in mind, consider Friday's news that "consumer credit jumps by most in 6 months".

With this post in mind, please consider the article "Why it pays to sell in May: Be ready to sell at the first sign of market weakness".


We receive no remuneration or incentive directly or indirectly in any way, shape, or form for buying or selling the positions we do, or for mentioning any positions or companies in this blog. If we hold existing positions we divulge the fact. This blog is merely a diary of some of our thoughts and trades and is in no way whatsoever to be considered investment advice of any kind. Always without fail consult a competent, experienced, and honest broker or investment advisor before making any investment or speculative decisions.

Please presume that we, she, he, I, it, them, they, us and you are purely fictional characters and that everything written in this blog is satire intended for comedic amusement only and not to be taken seriously in any way. Just like "real" analyst proclamations. Thank you.


To be notified when this blog is updated : Please e-mail christianguinness@hotmail.com with "Subscribe to blog" in the subject line or click here to do so automatically if your computer is configured accordingly. We have never shared our mailing list with anyone, nor will we. Please note that we only send update notifications when a trade idea is diarized or updated, not if a blog entry only contains general commentary.


Friday, April 05, 2013

European Equities, U.S. Treasuries, Japanese Equities, Yen and Stimulus


European markets look to be in the process of breaking down, bolstering our "short Europe" idea

London FTSE 100

Paris CAC 40

Frankfurt DAX


What hasn't broken down, at least not yet, is the Nikkei.  On April 1st we presented this chart.  Here's the updated version:


We cautioned that a Bank of Japan announcement was due Thursday, and yesterday's spike from the lower trend line was due to the BoJ news: "Bank of Japan unleashes world’s biggest burst of stimulus in $1.4-trillion shock therapy".

That's not great news for our yen long position, however we'll stick with it and adhere to the original stop level.  Reason being that it has taken an announcement of so-called stimulus of record-shattering proportion to put us back to the break-even level on the yen position despite it being levered, and with everyone saying this news will "destroy the yen" we're happy to remain positioned against popular sentiment at least a little while longer.

Here's an unusual take on the Japanese central bank action:


Here's another way to gauge when U.S. equities will drop; the U.S. 10-Year Treasury Note.   A close above 133 should coincide with a bearish move in equities:


We receive no remuneration or incentive directly or indirectly in any way, shape, or form for buying or selling the positions we do, or for mentioning any positions or companies in this blog. If we hold existing positions we divulge the fact. This blog is merely a diary of some of our thoughts and trades and is in no way whatsoever to be considered investment advice of any kind. Always without fail consult a competent, experienced, and honest broker or investment advisor before making any investment or speculative decisions.

Please presume that we, she, he, I, it, them, they, us and you are purely fictional characters and that everything written in this blog is satire intended for comedic amusement only and not to be taken seriously in any way. Just like "real" analyst proclamations. Thank you.


To be notified when this blog is updated : Please e-mail christianguinness@hotmail.com with "Subscribe to blog" in the subject line or click here to do so automatically if your computer is configured accordingly. We have never shared our mailing list with anyone, nor will we. Please note that we only send update notifications when a trade idea is diarized or updated, not if a blog entry only contains general commentary.

Wednesday, April 03, 2013

Russell2000 Small-Caps Breakdown, Copper, Silver (ZSL), Yen (YCL), Europe (EPV), OTS (Canadian Oilfield Solutions), Consumer Debt Supernova and the Coming End of QE?


As discussed recently here and here.  Check:


One more down, many more predicted breakdowns to come.

Recent predicted breakdowns that have come to pass include copper and silver.  We'll offer chart updates on those soon.  In the meantime, there may be bounces but they'll only be bounces on the way to much lower prices. 

On the bright side, OTS continues to look bullish.  Here's an updated chart:


Our posts on the Japanese yen and shorting Europe continue to look good too, and our general market short should soon be very profitable.   

If there's a theme here, it's the one that runs throughout the history of this blog.  We notice trends beginning or ending and try to take advantage.  It's when we look the most "wrong" or against-the-grain that we usually end up scoring the biggest gains, and lately we've been making a lot of very against-the-grain observations and calls.

Going back awhile, one such call was our assertion that the U.S. Federal Reserve's "Quantitative Easing" program would end sooner than later.  Many continue to believe it'll go on forever, and that they can't even consider putting an end to it.  Today the San Francisco Fed President lends credence to our view.


Throwing something new into the mix today, here's a great chart:


It was compiled from this government source of data.  We wonder how much will be paid down, especially so many student loans for worthless diplomas, and what the end results will be.


We receive no remuneration or incentive directly or indirectly in any way, shape, or form for buying or selling the positions we do, or for mentioning any positions or companies in this blog. If we hold existing positions we divulge the fact. This blog is merely a diary of some of our thoughts and trades and is in no way whatsoever to be considered investment advice of any kind. Always without fail consult a competent, experienced, and honest broker or investment advisor before making any investment or speculative decisions.

Please presume that we, she, he, I, it, them, they, us and you are purely fictional characters and that everything written in this blog is satire intended for comedic amusement only and not to be taken seriously in any way. Just like "real" analyst proclamations. Thank you.


To be notified when this blog is updated : Please e-mail christianguinness@hotmail.com with "Subscribe to blog" in the subject line or click here to do so automatically if your computer is configured accordingly. We have never shared our mailing list with anyone, nor will we. Please note that we only send update notifications when a trade idea is diarized or updated, not if a blog entry only contains general commentary.