Riding The Gravy Train: July 2013

Riding The Gravy Train

Beating the market is fun and profitable. This is how we do it.

Tuesday, July 30, 2013

General Electric (GE) Chart Study


We've no position in GE, and no intention to take one at this time. 

Perhaps in the future there'll be an opportunity, based on the chart which is self-explanatory:


GE broke above $10 decisively in August 1995 and hit it's all-time high exactly 5 years later in August 2000. 

The first plunge ended two years later in September 2002 and the 2nd 5-year bull run ended 5 years after that, in August 2007.

The 2nd plunge lasted 18 months, ending in February 2009.  If the pattern continues the current bull run would end sometime next year.

If the current run continues at the existing rate, sometime next year is when the stock price would meet the long-term downtrend shown in black. 


We receive no remuneration or incentive directly or indirectly in any way, shape, or form for buying or selling the positions we do, or for mentioning any positions or publicly traded companies in this blog. If we hold existing positions we divulge the fact. This blog is merely a diary of some of our thoughts and trades and is in no way whatsoever to be considered investment advice of any kind. Always without fail consult a competent, experienced, and honest broker or investment advisor before making any investment or speculative decisions.

Please presume that we, she, he, I, it, them, they, us and you are purely fictional characters and that everything written in this blog is satire intended for comedic amusement only, and not to be taken seriously in any way. Just like "real" analyst proclamations. Thank you.


To be notified when this blog is updated : Please e-mail christianguinness@hotmail.com with "Subscribe to blog" in the subject line or click here to do so automatically if your computer is configured accordingly. We have never shared our mailing list with anyone, nor will we. Please note that we only send update notifications when a trade idea is diarized or updated materially, not if a blog entry only contains general commentary.

Monday, July 29, 2013

Oil Chart Updated, Consumer Sentiment Jumps


On July 3rd, we effectively went long oil via USO.

At the time, we wrote: "The downtrend, in green, is not yet broken, and more overhead resistance remains at previous peaks (roughly $110 and $118), but we'll speculate on oil continuing higher."

Below is an updated chart, showing that the downtrend was broken as expected and that oil stopped just below the $110 resistance (marked by the black horizontal line):


As long as the uptrend (in red) remains intact, we'll expect the oil price to keep rising thus we'll hold USO.


Friday we learned: US consumer sentiment jumps to six-year high

Many see this news as very bullish.  We'd remind them that multi-year highs always precede a turn towards multi-year lows.


We receive no remuneration or incentive directly or indirectly in any way, shape, or form for buying or selling the positions we do, or for mentioning any positions or publicly traded companies in this blog. If we hold existing positions we divulge the fact. This blog is merely a diary of some of our thoughts and trades and is in no way whatsoever to be considered investment advice of any kind. Always without fail consult a competent, experienced, and honest broker or investment advisor before making any investment or speculative decisions.

Please presume that we, she, he, I, it, them, they, us and you are purely fictional characters and that everything written in this blog is satire intended for comedic amusement only, and not to be taken seriously in any way. Just like "real" analyst proclamations. Thank you.


To be notified when this blog is updated : Please e-mail christianguinness@hotmail.com with "Subscribe to blog" in the subject line or click here to do so automatically if your computer is configured accordingly. We have never shared our mailing list with anyone, nor will we. Please note that we only send update notifications when a trade idea is diarized or updated materially, not if a blog entry only contains general commentary.

Tuesday, July 23, 2013

AGQ Chart Study


AGQ is the ProShares Ultra Silver ETF, in which we've speculated with some success of late. 

Today we present a quick chart study. 

First the 1-year chart.  Green means "go", and above the green downtrend lines this would be a more prudent speculation.:


Below is a 3-month chart for a closer look:


Anything could happen, and we remain totally confident that gold and silver are nowhere near the eventual lows, however in the short term we continue to expect an ongoing bounce.  The result would be AGQ first rising to at least $20 to fill the "gap" delineated in red, then perhaps continue higher.  The $30-$35 range is possible.

Failure to reach at least $20 in the next week or two would reveal extreme weakness, and trading below $16 would be a sign of real danger. 


We receive no remuneration or incentive directly or indirectly in any way, shape, or form for buying or selling the positions we do, or for mentioning any positions or publicly traded companies in this blog. If we hold existing positions we divulge the fact. This blog is merely a diary of some of our thoughts and trades and is in no way whatsoever to be considered investment advice of any kind. Always without fail consult a competent, experienced, and honest broker or investment advisor before making any investment or speculative decisions.

Please presume that we, she, he, I, it, them, they, us and you are purely fictional characters and that everything written in this blog is satire intended for comedic amusement only, and not to be taken seriously in any way. Just like "real" analyst proclamations. Thank you.


To be notified when this blog is updated : Please e-mail christianguinness@hotmail.com with "Subscribe to blog" in the subject line or click here to do so automatically if your computer is configured accordingly. We have never shared our mailing list with anyone, nor will we. Please note that we only send update notifications when a trade idea is diarized or updated materially, not if a blog entry only contains general commentary.

Buying VXX or HUV. Again.


On May 22 we bought VXX (or HUV for those who prefer a Canadian equivalent or currency diversification).  On June 20 we booked over 20% gains on the position in just one month. 

A couple days later, and only slightly higher, both topped and have since plunged to new lows for the year.  Nobody seems to want this hedge, so we'll buy it back on what seems to be the cheap.

VXX was last at $15.83, HUV at $8.77  This will be a full position, with no stop in place for now.

Suggested calls this time are the December $18 calls, last traded at $1.75

Certainly markets could continue higher in the coming days, weeks and months, however to us that idea seems something between wishful thinking and just plain greedy.  Betting against the fantasies and greed of the aggregate of market participants is usually a prudent and profitable thing, as we've demonstrated so often over the years via this blog, so we're comfortable once again adding VXX. 

The chart looks very ugly, so it's purely an instinct call:


We continue to hold existing positions in VXX and SH bought earlier this year (ref: first link above).


We receive no remuneration or incentive directly or indirectly in any way, shape, or form for buying or selling the positions we do, or for mentioning any positions or publicly traded companies in this blog. If we hold existing positions we divulge the fact. This blog is merely a diary of some of our thoughts and trades and is in no way whatsoever to be considered investment advice of any kind. Always without fail consult a competent, experienced, and honest broker or investment advisor before making any investment or speculative decisions.

Please presume that we, she, he, I, it, them, they, us and you are purely fictional characters and that everything written in this blog is satire intended for comedic amusement only, and not to be taken seriously in any way. Just like "real" analyst proclamations. Thank you.


To be notified when this blog is updated : Please e-mail christianguinness@hotmail.com with "Subscribe to blog" in the subject line or click here to do so automatically if your computer is configured accordingly. We have never shared our mailing list with anyone, nor will we. Please note that we only send update notifications when a trade idea is diarized or updated materially, not if a blog entry only contains general commentary.

Monday, July 22, 2013

Gold, Silver and Newmont (NEM) Update


Our last update was July 11.  Apple did hold those gains, then went higher, and we did book the gains on those AAPL calls a few days later, for a gain of roughly 350%.

Since then, we've been enjoying summer and hope our readers have too.  Nothing has changed in our views or positions, so we felt no need to add to the market noise.  This in itself is instructive.  While most everyone feared extreme volatility surrounding Ben Bernanke's semi-annual two-day testimony before U.S. Congress last Wednesday and Thursday, followed by Friday being the last day of trading for July options, in fact it turned out to be one of the least volatile weeks of the past year.

Statistically, that is not unusual.  Pundits need to fill space and fabricate, both out of ignorance and inexperience, reasons or attributions for market moves when in fact most moves are common and well within the norm no matter what the news of the day is.  Recall this was the case back during the Cyprus "crisis" as we pointed out at the time, and it is often the case at options expiry.  Simply, always have a plan and always trade your plan without 2nd-guessing ... so long as it is a prudent plan.

Similarly, today's jump in gold and silver is nothing to get excited about.  Both are still way down from levels of even six weeks ago and the expected bounce so far has been uncertain, small, and slow.  The chance of the recent lows being "the" bottom, as so many hope, is very near zero.

Those new to the blog, especially gold or silver bulls, are strongly encouraged to read all entries from at least the past two months.  Those who read us regularly are aware of the industry-leading accuracy we've enjoyed with respect to calling, and profiting, from moves in precious metals. 

Over the past month, we turned bullish on gold and silver for the first time since the highs in 2011, and with today's pop upward we seem to have been correct, and right on time, yet again.

A downtrend in GDX, the gold miners ETF, seems to be broken:


However the actual metals are still far from a bullish turn.

See first the "gold gaps chart" we last updated on July 07.   What we wrote then turned out to be exactly accurate, as today GLD hit $129.46  If GLD can move decisively above that $130 level, and above the downtrend shown in red on the charts in that post, we can perhaps start to expect it'll revisit levels above $140.

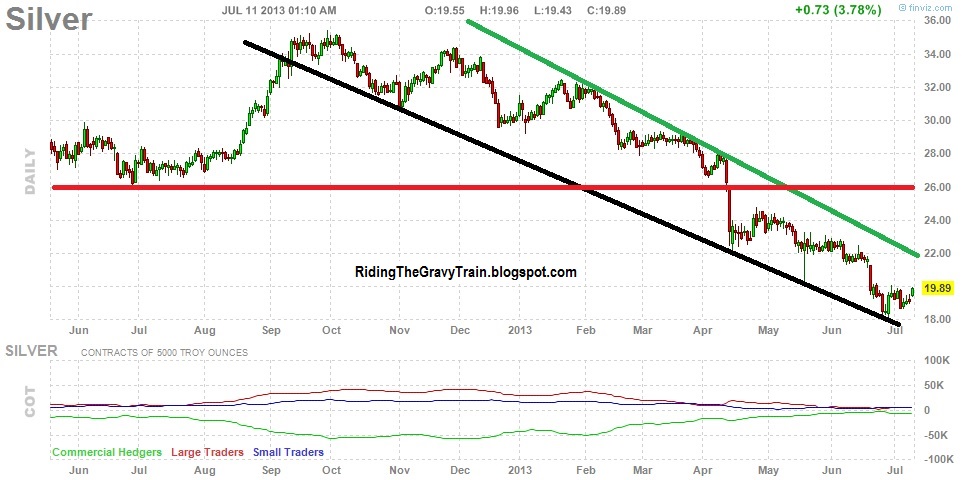
Of course silver will move essentially in tandem with gold, up or down.  Other key charts can be seen in this posting from July 11

We don't feel there is value in updating those charts yet, as the key trends illustrated are still in effect.

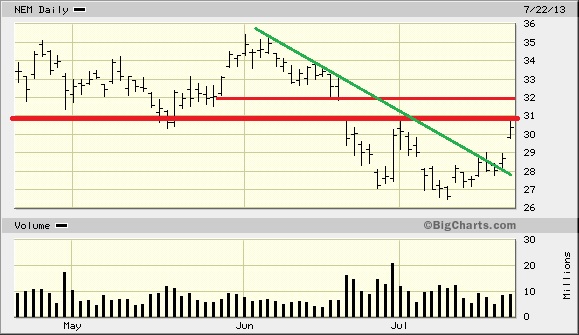
We do feel it's prudent to raise our NEM stop to $28.50 on a closing basis.  We've gotten lucky with that one, especially compared to the vast majority of other longs in the stock who can only dream of someday stopping out at a profit.  When we entered NEM on June 27, we suggested that circa $26.50 was a prudent conservative stop level.  Nine days later the low, so far, was $26.47 

Here's how NEM looks currently, short and long-term:


We'll try to ride the rally in mining stocks, and metals, until near the top of the bounce.  Our luck or timing may run out eventually, however we're totally confident it is only a bounce though it might be a protracted one so we could be holding long for awhile.  As usual, and ironically, despite being long metals and bullish the past while, we are still against the grain and that's when we're most comfortable and most profitable.  Once the herd is again bullish and buying rabidly, we'll be shorting. 

Again, the long-term outlook by any technical, logical, or fundamental analysis is for much lower prices in gold, silver, and miners.


The following article suggests nothing new to readers of this blog, however such important points are worth reiterating and sometimes that's best done via a fresh source: Gold is a popping bubble, too 

The author's "5 bubbles investors need to watch" is also worth consideration.


We receive no remuneration or incentive directly or indirectly in any way, shape, or form for buying or selling the positions we do, or for mentioning any positions or publicly traded companies in this blog. If we hold existing positions we divulge the fact. This blog is merely a diary of some of our thoughts and trades and is in no way whatsoever to be considered investment advice of any kind. Always without fail consult a competent, experienced, and honest broker or investment advisor before making any investment or speculative decisions.

Please presume that we, she, he, I, it, them, they, us and you are purely fictional characters and that everything written in this blog is satire intended for comedic amusement only, and not to be taken seriously in any way. Just like "real" analyst proclamations. Thank you.


To be notified when this blog is updated : Please e-mail christianguinness@hotmail.com with "Subscribe to blog" in the subject line or click here to do so automatically if your computer is configured accordingly. We have never shared our mailing list with anyone, nor will we. Please note that we only send update notifications when a trade idea is diarized or updated materially, not if a blog entry only contains general commentary.

Thursday, July 11, 2013

Apple (AAPL) Chart & Earnings Report Date


On June 24 we wrote:

"A bounce seems due in Apple shares and for those having waited to cover shorts or for a good long entry point, now is a good time."

This is the chart we offered at the time:


Apple bottomed a few days later and a few dollars lower, right on that uptrend line shown in red, and is now up 5.5% from our call. 

Here's an updated chart:


We'd participated in the bounce idea via July $400 calls (not diarized) which are currently up over 250%.  If AAPL fails to hold its meagre gains today (+ $1.95 as of this writing), given the market is up almost 1%, we'll book the profit on the calls and suggest anyone else who was playing for a short-term bounce consider doing the same on long positions. 

Apple  reports on Tuesday July 23, so there could be volatility leading up to, and certainly immediately after that date.  We doubt the report will be considered good news, so when we do close the calls we may even roll the profits into a double-or-nothing put position expiring in August or later. 

We're most likely to do so if equities markets keep rising for the next few days, or into the end of next week after Bernanke's semi-annual testimony to Congress on Wednesday and Thursday. 


We receive no remuneration or incentive directly or indirectly in any way, shape, or form for buying or selling the positions we do, or for mentioning any positions or publicly traded companies in this blog. If we hold existing positions we divulge the fact. This blog is merely a diary of some of our thoughts and trades and is in no way whatsoever to be considered investment advice of any kind. Always without fail consult a competent, experienced, and honest broker or investment advisor before making any investment or speculative decisions.

Please presume that we, she, he, I, it, them, they, us and you are purely fictional characters and that everything written in this blog is satire intended for comedic amusement only, and not to be taken seriously in any way. Just like "real" analyst proclamations. Thank you.


To be notified when this blog is updated : Please e-mail christianguinness@hotmail.com with "Subscribe to blog" in the subject line or click here to do so automatically if your computer is configured accordingly. We have never shared our mailing list with anyone, nor will we. Please note that we only send update notifications when a trade idea is diarized or updated materially, not if a blog entry only contains general commentary.


Bernanke Miracle? Silver and Gold Charts Updated


Regarding our NEM position, earlier we wrote that "we will hold the shares if by some miracle it opens and holds to close above our $27 stop tomorrow".

In after-market news, we read: 

Bernanke stresses rates to stay low for long time

We'll stress that it's impossible for him to say that with certainty given that the Fed doesn't truly control rates, he'll be gone in a short time, and half the Fed sees QE ending this year.  At best the Fed can correlate or influence rates, but rates are truly set in debt markets and the Fed cannot distort those markets for long even with a program 10 times the size of QE.

However apparently in response to Bernanke's statements, as of 1:30 AM, the DJIA is up over 150 points, gold is up $40 to $1288 and silver is up $0.76 to $19.96 

NEM was last bid at $27.31, up over 2.5% from the close, so Chairman Bernanke's blather might be the miracle we needed to cause us to hold onto it for awhile longer.

It's a silly overreaction in the markets so far, which probably won't last long but hopefully it lasts long enough to turn our gold and silver bounce positions to big winners. 

That said, even tonight's buying in metals so far is very weak compared to the collapse of recent weeks.  If it takes such unusual and extreme statements from the head of the U.S. Federal Reserve to rally metals only this much, despite them being so "oversold", that's still not going to allow any responsible precious metals longs to rest easy.  (Please see "The 'Oversold' Myth, Using Silver As An Example" if you've not read it).

For now however, it looks like Thursday will bring the bounce we've been waiting for and that should kick-off a bigger rally. 

Below are charts of how gold and silver look to us.  Charts are current as of this writing, and as usual can be clicked to view a larger version. 


Above the green downtrend lines we can expect the bounce to perhaps morph into a more protracted rally.  Above the red lines we could even entertain some bullish discussion for the intermediate term. 

Long-term we remain firmly bearish gold and silver, as we've been since long before it became fashionable, and bullish the U.S. dollar. 


We receive no remuneration or incentive directly or indirectly in any way, shape, or form for buying or selling the positions we do, or for mentioning any positions or publicly traded companies in this blog. If we hold existing positions we divulge the fact. This blog is merely a diary of some of our thoughts and trades and is in no way whatsoever to be considered investment advice of any kind. Always without fail consult a competent, experienced, and honest broker or investment advisor before making any investment or speculative decisions.

Please presume that we, she, he, I, it, them, they, us and you are purely fictional characters and that everything written in this blog is satire intended for comedic amusement only, and not to be taken seriously in any way. Just like "real" analyst proclamations. Thank you.


To be notified when this blog is updated :
Please e-mail christianguinness@hotmail.com with "Subscribe to blog" in the subject line or click here to do so automatically if your computer is configured accordingly. We have never shared our mailing list with anyone, nor will we. Please note that we only send update notifications when a trade idea is diarized or updated materially, not if a blog entry only contains general commentary.


Wednesday, July 10, 2013

Federal Reserve Minutes, Oil, Goldman Sachs, Newmont Mining (NEM)


It wasn't long ago that it seemed no one but us believed "QE" would ever end, and we felt alone in the assertion it'd end soon.  Now: Half of Fed sees QE end late this year.

Next Wednesday and Thursday is Federal Reserve Chairman Ben Bernanke's semi-annual testimony to Congress on monetary and rates policy.  Perhaps there'll be volatility surrounding that. 

Today's release of minutes of last month's Federal Reserve meeting had no effect on equities markets or precious metals, as both ended the day almost exactly the same as before the release of the minutes earlier in the day.

Recently we bought oil.  It looks like the trend is breaking upward, with possible near-term resistance at the previous highs (red lines):


Early this year we warned that Goldman Sachs and silver "should soon break down".  Later that morning GS stock began a 2-month drop of over 13% and silver has since been down as much as 40%. 

In late March we posted the GS chart below, stating: "A chart of the overall market should soon look the same, and we remain confident that GS will connect with its uptrend (in black) later this year while the DJIA proceeds to drop at least 800-1000 points from its recent highs."


Does the overall market look the same?  Here's a current chart of the DJIA.  It did break down 1000 points, but only after first going 1000 points higher:


Perhaps if the market soon breaks to new lows we could argue that the topping patterns are similar. 

What is inarguable is that the GS uptrend has since been met, twice in fact:


A new market decline should coincide with GS eventually breaking that uptrend decisively.  We're of the belief that both GS and the DJIA will post new summertime lows, however for now both look stable.


What of gold and silver?   Bluntly, the price action since the recent lows has been remarkably weak and that's especially true in mining shares.  As of today's close, we're stopped out of our Newmont Mining position for a small loss.  We will hold the shares if by some miracle it opens and holds to close above our $27 stop tomorrow, but that's highly unlikely so we expect to close the position. 

We still have plenty other gold and silver-related longs since recently turning from long-term bears to short-term bullish for a bounce, as diarized herein many times recently.  Here are the posts relevant to this NEM position:

Buying NEM with initial stop at $21.  We noted long-term trend support circa $26, which is still true and hopefully that holds for the desperate longs still clinging to this disaster that's down 63% in the past nine months. 

Here's a look at the NEM trend.  Those not overexposed to miners or precious metals may wish to hold long above that red line:


Most importantly, when buying NEM we'd warned: "The vast majority of people bought at higher prices, some far higher.  In other words, the majority took a loss or are still holding on at a loss.  Don't become one of them.  Stay away from risk or at least use prudent stops if you participate."

Accordingly, we later raised our stop to $25 and finally to $27.  Enough is enough and while it's both disappointing and disconcerting that NEM has continued to slide despite stock markets going higher and gold and silver bouncing a little, we're not so much worried for this loss as we are for the remaining long positions relating to gold and silver.


We receive no remuneration or incentive directly or indirectly in any way, shape, or form for buying or selling the positions we do, or for mentioning any positions or publicly traded companies in this blog. If we hold existing positions we divulge the fact. This blog is merely a diary of some of our thoughts and trades and is in no way whatsoever to be considered investment advice of any kind. Always without fail consult a competent, experienced, and honest broker or investment advisor before making any investment or speculative decisions.

Please presume that we, she, he, I, it, them, they, us and you are purely fictional characters and that everything written in this blog is satire intended for comedic amusement only, and not to be taken seriously in any way. Just like "real" analyst proclamations. Thank you.


To be notified when this blog is updated : Please e-mail christianguinness@hotmail.com with "Subscribe to blog" in the subject line or click here to do so automatically if your computer is configured accordingly. We have never shared our mailing list with anyone, nor will we. Please note that we only send update notifications when a trade idea is diarized or updated materially, not if a blog entry only contains general commentary.


Monday, July 08, 2013

TBT, U.S Bonds


Today we update this post from May 29 titled "SJB, U.S. 30-Year Bonds, 10-Year Notes, TBT, Gold and Silver"

In it we wrote: "... we're very confident of much higher rates, and the rates will turn higher much sooner than anyone expects and regardless of so-called Quantitative Easing efforts continuing or not."

We showed two charts suggesting that TBT, an existing holding, looked ready to break-out.  It did, coinciding with rates popping higher and sooner than most anyone expected.  TBT hit a fresh 52-week high this Friday, closing 14% higher than when we made that observation. 

Below is an updated TBT chart.  We expect at least 1/3 of that multi-year drop to eventually be retraced.


On the flipside of rising rates, this has meant that U.S. debt didn't bounce where there seemed to be technical support (see charts in link above). 

Here's how the U.S. 10-Year Note and 30-Year Bond looks to us now:


As can also be seen in that posting linked above, we've been correct about shorting junk bonds via SJB.  The suggested options in that post have since traded as much as 550% higher, while the shares have been up as much as 10%.


We receive no remuneration or incentive directly or indirectly in any way, shape, or form for buying or selling the positions we do, or for mentioning any positions or publicly traded companies in this blog. If we hold existing positions we divulge the fact. This blog is merely a diary of some of our thoughts and trades and is in no way whatsoever to be considered investment advice of any kind. Always without fail consult a competent, experienced, and honest broker or investment advisor before making any investment or speculative decisions.

Please presume that we, she, he, I, it, them, they, us and you are purely fictional characters and that everything written in this blog is satire intended for comedic amusement only, and not to be taken seriously in any way. Just like "real" analyst proclamations. Thank you.


To be notified when this blog is updated : Please e-mail christianguinness@hotmail.com with "Subscribe to blog" in the subject line or click here to do so automatically if your computer is configured accordingly. We have never shared our mailing list with anyone, nor will we. Please note that we only send update notifications when a trade idea is diarized or updated materially, not if a blog entry only contains general commentary.


Sunday, July 07, 2013

Gold Commentary and Gaps Chart Updated


If you haven't already, please first read our short posting from June 25th titled "The "Oversold" Myth, Using Silver As An Example"  It should not be a shock that since then silver (and gold) sold off further. 

An interesting thing has happened the past few days however, especially after Friday's renewed plunge in gold and silver.  Bulls are no longer talking "oversold", pessimism is extremely high, and everyone seems to be discussing where the next downside target is.  By contrast, we're looking at upside targets.

On July 01, we wrote: "Yes, gold can and will go much lower the only question is "when?".  Perhaps soon, and there might not even be a bounce first.  Be prepared for that.

And with that said, it seems fear of a further plunge remains widespread so per our usual contrarian stance we expect that any selling is likely not to push gold or silver to new lows in the near term ($1180 gold, $18.50 silver)."


Friday precious metals dropped big yet again, as we'd warned could occur with no bounce first.  We still believe that gold and silver won't go to new lows for awhile.

Note the chart of gold gaps discussed in that link above, reproduced here (click charts to enlarge):

Below is an updated version, showing that gold went on to fill that first gap as expected (red circle) and we think it will hold above the recent lows  (red horizontal line)  for now.  Our interpretation of this chart is that GLD will approach $130 or at least rise to meet the downtrend in the next week or two.


Here's an interesting story: "People Can't Protect Their Culture When They're On Welfare"


We receive no remuneration or incentive directly or indirectly in any way, shape, or form for buying or selling the positions we do, or for mentioning any positions or publicly traded companies in this blog. If we hold existing positions we divulge the fact. This blog is merely a diary of some of our thoughts and trades and is in no way whatsoever to be considered investment advice of any kind. Always without fail consult a competent, experienced, and honest broker or investment advisor before making any investment or speculative decisions.

Please presume that we, she, he, I, it, them, they, us and you are purely fictional characters and that everything written in this blog is satire intended for comedic amusement only, and not to be taken seriously in any way. Just like "real" analyst proclamations. Thank you.


To be notified when this blog is updated : Please e-mail christianguinness@hotmail.com with "Subscribe to blog" in the subject line or click here to do so automatically if your computer is configured accordingly. We have never shared our mailing list with anyone, nor will we. Please note that we only send update notifications when a trade idea is diarized or updated materially, not if a blog entry only contains general commentary.

Wednesday, July 03, 2013

Oil Over $100, Buying USO


We've not expected oil to go higher, however it's now over $100 and a push above a key level such as the $100 mark requires interest and action on our part.

Here's the chart:


The downtrend, in green, is not yet broken, and more overhead resistance remains at previous peaks (roughly $110 and $118), but we'll speculate on oil continuing higher via opening a long position in USO.

We'll give this one a long leash, placing stops below $29 closes.  For USO to get that low oil will probably have to be below its 2011 and 2012 lows, which is to say below $80.

Options traders might prefer the USO January 2015 $36 calls, last traded at $3.55 


Even the best make big mistakes, resulting in big losses: Einhorn's Greenlight fund hit by gold price drop.


We receive no remuneration or incentive directly or indirectly in any way, shape, or form for buying or selling the positions we do, or for mentioning any positions or publicly traded companies in this blog. If we hold existing positions we divulge the fact. This blog is merely a diary of some of our thoughts and trades and is in no way whatsoever to be considered investment advice of any kind. Always without fail consult a competent, experienced, and honest broker or investment advisor before making any investment or speculative decisions.

Please presume that we, she, he, I, it, them, they, us and you are purely fictional characters and that everything written in this blog is satire intended for comedic amusement only, and not to be taken seriously in any way. Just like "real" analyst proclamations. Thank you.


To be notified when this blog is updated : Please e-mail christianguinness@hotmail.com with "Subscribe to blog" in the subject line or click here to do so automatically if your computer is configured accordingly. We have never shared our mailing list with anyone, nor will we. Please note that we only send update notifications when a trade idea is diarized or updated materially, not if a blog entry only contains general commentary.

Tuesday, July 02, 2013

Goldman Sachs Lowers Gold Outlook


In April we effectively, and so far profitably, shorted junk bonds and noted that Goldman Sachs was recommending shorting gold

We'd already been bearish and short gold for some time.  We remain so, in the longer term, as apparently does Goldman Sachs:  Hedge Funds Cut Gold Bets As Goldman Sachs Lowers Outlook


Quoting and commenting on excerpts from the article:

"Gold futures dropped 23 percent last quarter, the most since Bloomberg data begins in 1975."

When this happens over 10 years into a raging bull market, that bull market is over. 


"Goldman expects prices to drop to $1,050 by the end of next year, 17 percent less than its previous forecast of $1,270, the bank’s analysts said in a June 23 report. Declines will continue as the Fed trims its bond-buying program and investors sell ETP holdings, the bank said."

So far, even when the bank was bullish on gold, their price estimates have proven to be on the high side.  That'll probably continue to prove true. 


"Bullion’s declines are “shattering” investors’ confidence and the metal will probably fall to $1,150 in 12 months, Credit Suisse’s head of commodity research, Ric Deverell, said in a report June 25. Morgan Stanley lowered its 2014 outlook by 16 percent the same day, citing waning demand for haven assets."

It was, and remains, all about confidence - or more accurately about sentiment, hype, lies and willful ignorance of human nature and market history.  A long-term bottom will not occur until people give up on delusions and accept the facts.


We receive no remuneration or incentive directly or indirectly in any way, shape, or form for buying or selling the positions we do, or for mentioning any positions or publicly traded companies in this blog. If we hold existing positions we divulge the fact. This blog is merely a diary of some of our thoughts and trades and is in no way whatsoever to be considered investment advice of any kind. Always without fail consult a competent, experienced, and honest broker or investment advisor before making any investment or speculative decisions.

Please presume that we, she, he, I, it, them, they, us and you are purely fictional characters and that everything written in this blog is satire intended for comedic amusement only, and not to be taken seriously in any way. Just like "real" analyst proclamations. Thank you.


To be notified when this blog is updated : Please e-mail christianguinness@hotmail.com with "Subscribe to blog" in the subject line or click here to do so automatically if your computer is configured accordingly. We have never shared our mailing list with anyone, nor will we. Please note that we only send update notifications when a trade idea is diarized or updated materially, not if a blog entry only contains general commentary.

Timing Isn't Everything, ABX (Barrick Gold) Chart Study


Some say "timing is everything".  Good timing is certainly a major difference between winners and losers, however there are other important factors.  One is selection.

Thursday we bought NEM (Newmont Mining), after being bearish on gold and gold stocks for all of the past two years.  Two days later, it was 12% higher.  It's still over 6% higher as of this writing. 

What if we'd chosen another globally popular mining stock instead, such as Barrick Gold (ABX)?  It rose 8% in the same time frame, but is now down almost 3%.  That's despite the fact that stock markets and gold are higher over that time span. 

Here's a look at the chart: 


The top panel in the above chart is a 1-year look at Barrick, showing the downtrend in red and a downward channel in black.  Safest entries would be below $12, otherwise something like NEM is a much better bet in our view. 

The bottom two panels in the chart above show 5-day views of first ABX then NEM for comparison.  ABX continues to display remarkable absolute and relative weakness. 


The days when people could imprudently put money into any mining stock and make money are long gone.  The rush of people buying into gold, in both fantasy and in fact with their hard-earned and easily-lost money, is over.  The rush of mutual or hedge funds and analysts to outdo each other with ridiculous and now obviously flawed price predictions and entry levels is over.  The rush now and for a long time to come is to get out with whatever capital and credence is left intact. 

Even if buying at today's pricing people will be lucky to make a profit and to do so they'll require terrific timing and smart selection. 


We receive no remuneration or incentive directly or indirectly in any way, shape, or form for buying or selling the positions we do, or for mentioning any positions or publicly traded companies in this blog. If we hold existing positions we divulge the fact. This blog is merely a diary of some of our thoughts and trades and is in no way whatsoever to be considered investment advice of any kind. Always without fail consult a competent, experienced, and honest broker or investment advisor before making any investment or speculative decisions.

Please presume that we, she, he, I, it, them, they, us and you are purely fictional characters and that everything written in this blog is satire intended for comedic amusement only, and not to be taken seriously in any way. Just like "real" analyst proclamations. Thank you.


To be notified when this blog is updated : Please e-mail christianguinness@hotmail.com with "Subscribe to blog" in the subject line or click here to do so automatically if your computer is configured accordingly. We have never shared our mailing list with anyone, nor will we. Please note that we only send update notifications when a trade idea is diarized or updated materially, not if a blog entry only contains general commentary.

Monday, July 01, 2013

NEM (Newmont Mining), Gold Update


This recent post sets us up for today's commentary -  Gold And Silver Update, Commentary And Charts - however those new to this blog should start with the following posting, which provides an overview of our commentary on gold and silver thus far:
Gold, Silver, Updated Chart Of Psychology Of Gold And Silver Investors, PSON, China PMI Hits 9-Month Low, Swiss Lawmakers Reject Government Plan On Banking Secrecy


Below is a current GLD chart, the gold ETF.  We expect pauses on the way up - if gold actually goes any higher - at or between the black gap lines.  Click for a larger image:


We'll keep in mind this quote from our special posting on May 22: "There's a good chance of one more leg down [...]  It could be a small drop, or massive with the resulting bounce not even making it back to today's levels."

That would correspond to approximately $130 in GLD, and as can be seen on the chart above there's a lot of resistance above that level, including the down-trending red line.  Yes, gold can and will go much lower the only question is "when?".  Perhaps soon, and there might not even be a bounce first.  Be prepared for that.

And with that said, it seems fear of a further plunge remains widespread so per our usual contrarian stance we expect that any selling is likely not to push gold or silver to new lows in the near term ($1180 gold, $18.50 silver).


We'll raise our NEM stop further, to $27 on a closing basis, to mitigate risk in case new near-term lows are made in metals or in Newmont. 


We receive no remuneration or incentive directly or indirectly in any way, shape, or form for buying or selling the positions we do, or for mentioning any positions or publicly traded companies in this blog. If we hold existing positions we divulge the fact. This blog is merely a diary of some of our thoughts and trades and is in no way whatsoever to be considered investment advice of any kind. Always without fail consult a competent, experienced, and honest broker or investment advisor before making any investment or speculative decisions.

Please presume that we, she, he, I, it, them, they, us and you are purely fictional characters and that everything written in this blog is satire intended for comedic amusement only, and not to be taken seriously in any way. Just like "real" analyst proclamations. Thank you.


To be notified when this blog is updated : Please e-mail christianguinness@hotmail.com with "Subscribe to blog" in the subject line or click here to do so automatically if your computer is configured accordingly. We have never shared our mailing list with anyone, nor will we. Please note that we only send update notifications when a trade idea is diarized or updated materially, not if a blog entry only contains general commentary.