Gold 5-year chart with possible Elliot Wave labelling, indicating we are near the top of subwave "iii" of wave "5", at which point gold would be making a major top of significant duration.
A simple explanation is that gold should soon see a decline to roughly the $1000 level before a sharp push to new highs.
Our TCK November straddle expired Friday, at an overall loss of 13%.
Thus far on options plays in this blog we scored +100% on BUD , +96% on UNG , and now -13% on TCK. It's admittedly a disconcerting trend of decline, however still an average score of +61% which we're very pleased with.
A fifth-straight monthly gain for the Case-Shiller Index Tuesday and Monday's stronger-than-expected existing home sales report is giving renewed hope to the housing bulls.
"Disregard them," says Barry Ritholtz, CEO of Fusion IQ, who notes the existing home sales number was juiced by sales of cheap condos and various government programs. Meanwhile, the Case-Shiller results were below expectations.
"We are not even close to a bottom in housing", says Ritholtz, who estimates national house prices remain 15-20% overvalued, based on the traditional metrics of: median income-to-median sales price, the cost of owning vs. renting, and housing stock as a percent of GDP.
We receive no remuneration or incentive directly or indirectly in any way, shape, or form for buying or selling the stocks we do, or for mentioning any stocks or companies in this blog. If we hold existing positions we divulge the fact.
This blog is merely a diary of some of our thoughts and trades and is in no way whatsoever to be considered investment advice of any kind. Always without fail consult a competent, experienced, and honest broker or investment advisor before making any investment or speculative decisions.
To be notified when this blog is updated : Please e-mail christianguinness@hotmail.com with "Subscribe to blog" in the subject line or click here to do so automatically if your computer is configured accordingly. We have never shared our mailing list with anyone, nor will we. Please note that we only send update notifications when a trade idea is diarized or updated, not if a blog entry only contains general commentary.
Meredith Whitney, the analyst who has no "buy" recommendations on U.S. banks, said valuations on lender stocks are too high and what "scares" her most is the government stepping away from buying mortgage-backed securities.
"The banks are still grossly overvalued," Whitney said today in an interview on Bloomberg Radio. "People are expecting something great to happen in 2010 and I think they are going to be severely disappointed."
Whitney said she doesn't expect consumer and small business spending to rebound and she forecast $2.7 trillion in credit lines being cut. She said she expects this year's holiday season to be at best "flat" versus last year.
– Bloomberg
Is "it" starting to hit the fan? Scenes like this, and worse, may become common.
But as long as sheeple can be bought off with their own money by government, things should be fine.
A unique video view of the shame and sham that was "Cash for Clunkers" :
"A good idea? Well, I suppose if the intent is to try to get Americans to be more of a debt slave when they're already choking on too much debt......."
"But many of those cashing in on the clunkers program are surprised when they get to the treasurer's office windows. That's because the government's rebate of up to $4500 dollars for every clunker is taxable."
We receive no remuneration or incentive directly or indirectly in any way, shape, or form for buying or selling the stocks we do, or for mentioning any stocks or companies in this blog. If we hold existing positions we divulge the fact.
This blog is merely a diary of some of our thoughts and trades and is in no way whatsoever to be considered investment advice of any kind. Always without fail consult a competent, experienced, and honest broker or investment advisor before making any investment or speculative decisions.
To be notified when this blog is updated : Please e-mail christianguinness@hotmail.com with "Subscribe to blog" in the subject line or click here to do so automatically if your computer is configured accordingly. We have never shared our mailing list with anyone, nor will we. Please note that we only send update notifications when a trade idea is diarized or updated, not if a blog entry only contains general commentary.
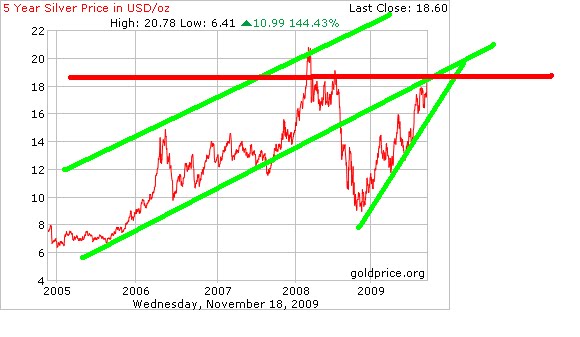
We find silver approaching an area of resistance, as marked by the horizontal red line. We note that it is in a "bearish rising wedge" which peaks in that same resistance area mentioned. The technical implications are very bearish should it break below the lowest ascending green line shown.
We also a see in silver a bearish non-confirmation of gold's breakout to new highs.
On the gold chart we see gold now apparently comfortably above the technical and psychological $1000 resistance level marked in red, however it too is in a rising bearish wedge with channel resistance overhead as marked by the green lines which suggest a peak for this move no higher than circa $1250.
That level is the same high implied by the "reverse head & shoulders" pattern found in the gold chart from early 2008 until it broke & held abvove $1000 recently.
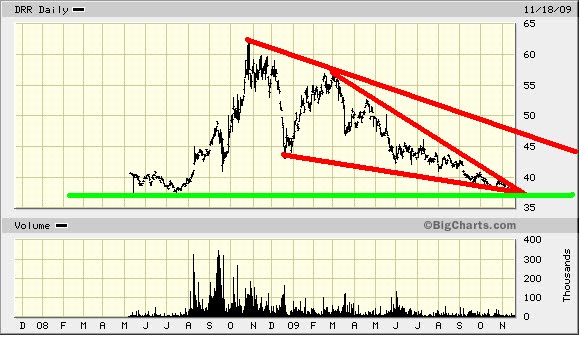
Both charts above show "descending bullish wedge" patterns and a current price at long-term support levels as marked by the horizontal green lines.
The speculative trades implied by these charts are obvious, and we'll keep a close watch on these trends for a potential entry.
Note that a major reversal in the U.S. Dollar would almost certainly correspond with a major reversal in global stock markets.
We receive no remuneration or incentive directly or indirectly in any way, shape, or form for buying or selling the stocks we do, or for mentioning any stocks or companies in this blog. If we hold existing positions we divulge the fact.
This blog is merely a diary of some of our thoughts and trades and is in no way whatsoever to be considered investment advice of any kind. Always without fail consult a competent, experienced, and honest broker or investment advisor before making any investment or speculative decisions.
To be notified when this blog is updated : Please e-mail christianguinness@hotmail.com with "Subscribe to blog" in the subject line or click here to do so automatically if your computer is configured accordingly. We have never shared our mailing list with anyone, nor will we. Please note that we only send update notifications when a trade idea is diarized or updated, not if a blog entry only contains general commentary.
Per our stated stop level we yesterday covered our short of First Solar, FSLR, for a 20% gain in 3 weeks.
We hope to re-enter short at higher levels, but for now the stock would be lucky to get above $130 and significant market strength will likely be required for that to happen.
Updated charts on some open positions :
CGP, Cornerstone Capital Resources, long. Half has been sold for 54% profit.
BMO, Bank of Montreal, short.
DRI, Darden Restaurants, short.
EMX, Eurasian Minerals, long.
We entered EMX in January of 2008 at $1.85 and enjoyed a quick spike in the share price but then let it get away from us on the downside as can be seen on the 2-year chart below. It happens occasionally, that we do not trade out of a stock when we should, and luckily in time we get a bailout of sorts thanks to the market.
EMX has enjoyed an excellent trailing 12 months, and is almost back to our entry price so we continue to hold hoping to finally realize a profit. We note however technical resistance just above current levels so we'll limit risk to the lower green rising trendline.
Note we wrote at the time that "we've firmly called a bear market for much longer than most commentators have even dared to consider a bear market possible, and we stick by our bearish sentiment believing today's highs in the markets may be the highest levels most stocks will enjoy for quite some time to come."
Indeed a 2-year chart of the DJIA, coupled with the cartoon found at the top of this post, puts those comments in perspective as well as the notion that we're in a bull market :
We receive no remuneration or incentive directly or indirectly in any way, shape, or form for buying or selling the stocks we do, or for mentioning any stocks or companies in this blog. If we hold existing positions we divulge the fact.
This blog is merely a diary of some of our thoughts and trades and is in no way whatsoever to be considered investment advice of any kind. Always without fail consult a competent, experienced, and honest broker or investment advisor before making any investment or speculative decisions.
To be notified when this blog is updated : Please e-mail christianguinness@hotmail.com with "Subscribe to blog" in the subject line or click here to do so automatically if your computer is configured accordingly. We have never shared our mailing list with anyone, nor will we. Please note that we only send update notifications when a trade idea is diarized or updated, not if a blog entry only contains general commentary.
This company enjoyed a good run when the uranium mania hit the junior markets in 2005 and 2006, a time which long-term readers of this blog will surely remember fondly as we enjoyed regular phenominal gains with speculations in that sector. Since then the stock has come all the way back down in price though the company's prospects remain compelling, especially so now that it's a silver speculation as well.
Alberta Star 2-year chart :
With the trend appearing to be reversing from down to up, and a new investor relations firm representing the company, we hope to be buying in advance of another big rally in Alberta Star's stock.
First Solar, FSLR continues to exhibit significant weakness daily vs. the overall market.
As shorts, that's good luck we enjoy in addition to the large price drop the stock suffered just days after we entered the trade. Currently we're ahead 19% on that position.
Even better, we now have a "head & shoulders" pattern in play on the stock, as seen on the chart below. The break of the "neckline" is a minor one, so far, but if this technical pattern is indeed in effect then we'll probably see the stock fall a bit farther before bouncing back to test the underside of the pattern. If that test fails, then the technicals suggest we should see the stock trading down near $100 before perhaps another bounce and then a steady slide much lower.
A brief rally would seem reasonable after such a sell-off, however even on strong market days the stock's rally attempts have failed thus we remain confident that the existing downtrend will continue even if a bounce of some significance finally takes place.
FSLR 2-year chart :
Should the stock trade down to $108 we'll close our position at that level for a profit of 30%. Until that might happen, our stop to cover remains in effect which we now lower again to $122.25.
We receive no remuneration or incentive directly or indirectly in any way, shape, or form for buying or selling the stocks we do, or for mentioning any stocks or companies in this blog. If we hold existing positions we divulge the fact.
This blog is merely a diary of some of our thoughts and trades and is in no way whatsoever to be considered investment advice of any kind. Always without fail consult a competent, experienced, and honest broker or investment advisor before making any investment or speculative decisions.
To be notified when this blog is updated : Please e-mail christianguinness@hotmail.com with "Subscribe to blog" in the subject line or click here to do so automatically if your computer is configured accordingly. We have never shared our mailing list with anyone, nor will we. Please note that we only send update notifications when a trade idea is diarized or updated, not if a blog entry only contains general commentary.
Despite Monday's big market rally, many divergences remain in effect and of concern.
Silver is not at new highs, while gold is. The DJIA made a new high for the year, however the S&P, NASDAQ, Utilities, and Transports (making non-confirmations per Dow Theory), as well as the French, English, Chinese, Japanese, Canadian, and Australian markets, just to mention a few, are not at new highs for the year.
Certain sectors, as illustrated Thursday, remain bearishly divergent. Financials and restaurants, for example. Admittedly some indexes and sectors are close to marking new highs, however most are not close at all.
Was Monday's action the start of a new leg up in the rally, or will we see another general reversal? The rally since March is still missing a significant correction, so we remain most comfortable being cautious.
All we can say for certain, is that there are few, if any, compelling reasons or indicators arguing for entering, or even holding, longs at these prices.
We are paying special attention to volume. As was the case Friday and Monday, volume is quite light on rally days, and the primary trend remains down, with its resistance not much above the current levels of the DJIA. The bear market downtrend allows for a high circa 10450 at present, as seen below.
Other indexes and lagging sectors resemble this NASDAQ graph, which illustrates the bearish implication of the year's rally trendline being broken recently and now back-tested.
First Solar, FSLR has continued to exhibit remarkable relative weakness during the market rally of the past few days. We can't take this for granted however, as it is oversold in the short term thus prone to a sharp reversal, though it's still greatly overvalued in our estimation.
We've been in this position less than 3 weeks so far, and we now lower our stop on FSLR from $181 to $124.70 which would net us a profit of 19% if hit. We chose this level as per the chart below. More aggressive shorts may wait until the stock moves above $130 or $135, but we prefer to keep our stop tight at this time and guarantee a big fast profit if it is hit, then we'd seek to short FSLR again if it rallies much from there.
To get to that level, FSLR would have to rise approximately twice as much as it did Monday, when it posted a relatively weak gain of 1.3% vs. the COMPQ's gain of nearly 2%. For such a beaten-down stock, such weakness doesn't suggest it will rise much, if at all, even if markets continue the week with spectacular rallies, but we can never be certain so we hedge by lowering our stop significantly.
We balance the above prudence with a somewhat aggressive move in which we'll short DRI, Darden Restaurants, should it reach a level of $32.75 which is just slightly above its Monday closing price of $32.68
Given rising unemployment and taxes, and decreasing consumer credit, we are not bullish of restaurants in general or those under the Darden corporate banner in particular.
We can't resist the relative weakness. Since March 18, DRI is flat while the NASDAQ composite is up 48% and the DJIA is up 38%. Monday DRI was up only a single penny, while its parent index was up nearly 2%.
Most of all, we're compelled by the technical markings seen on the chart below.
Not shown on the chart above is that the stock currently trades below its 200-day moving average and below its 200-week moving average, both technically bearish.
Regardless, it's what the charts reveal that guide us most so we offer a 2nd short position at $32.75 If filled, we'll cover this position should the price reach $41 for a potential risk of 25%. Our existing position remains without a stated stop level.
We've done well shorting restaurants in this blog in the past, marking gains of 17% in CAKE in 1 month and 19% in CBRL in 6 weeks in 2008. The 3rd time has not been a charm however as we are currently down roughly 14% on our existing DRI short, though we note that the NASDAQ is up a far greater 36% during that time so we feel relatively good about the position and now attempting to add to this short.
"In May, Standard & Poor's Corp. assigned the U.K.'s triple-A credit rating a negative outlook, saying it would make a decision on its rating after the new government makes its intentions clear.
The U.K.'s public finances have deteriorated sharply since last autumn with the country experiencing its deepest recession in decades. Output has contracted for six straight quarters and the numbers out of work have climbed steadily since mid-2008..."
We also found this video on his site. Amusing yet disgusting, this is a must-see !
"Which should bother you more, that half aren't even there, or what happens when they're not?"
We receive no remuneration or incentive directly or indirectly in any way, shape, or form for buying or selling the stocks we do, or for mentioning any stocks or companies in this blog. If we hold existing positions we divulge the fact.
This blog is merely a diary of some of our thoughts and trades and is in no way whatsoever to be considered investment advice of any kind. Always without fail consult a competent, experienced, and honest broker or investment advisor before making any investment or speculative decisions.
To be notified when this blog is updated : Please e-mail christianguinness@hotmail.com with "Subscribe to blog" in the subject line or click here to do so automatically if your computer is configured accordingly. We have never shared our mailing list with anyone, nor will we. Please note that we only send update notifications when a trade idea is diarized or updated, not if a blog entry only contains general commentary.
Today equities enjoyed the biggest 1-day rally of the past several months, once again celebrating economic data that even if presumed accurate (a very big "if") should arguably be seen as a negative rather than a positive.
An increase in worker productivity, as celebrated today, simply means that people with jobs are working that much harder, meaning new hires are that much less necessary. Other than for perhaps government employees, the gates to "Fat City" are closed and will remain so for quite some time to come.
Unemployment figures (per the Initial Claims data) were also taken as a positive, mostly by those seeking to pump the markets and those who can't understand the actual data and instead prefer to swallow the headlines. Unemployment "decreased" by virtue of more people going on extended benefits or dropping off the rolls altogether, as those people are not counted at all. Fact is that increasingly more people are unemployed, but the government twists and spins it of course.
However even the official government data shows real unemployment (known as "U6") to be over 17%.
This latter figure is what would have been reported as the unemployment rate decades ago, so bear in mind it is not an apples-to-apples comparison when the current nominal unemployment rate is compared to, for example, the unemployment rate during the Great Depression.
John Williams of Shadow Stats provides a more in-depth explanation in this interview :
Truth seekers will keep an eye on that U6 figure when the official unemployment rates are announced, and let's expect the nominal headline number to have increased to around 10% in Friday's pre-market announcement.
Relative Weakness Evident
Despite Thursday's market rally, it continues to look like the churning along a top of some significance with a great number of distribution days in evidence suggesting shares are passing from institutional investors to weaker retail hands. Insider sales keep mounting. This may be just an area of congestion on the way to new highs, but there are significant bearish divergences in some sectors to beware of - and in the case of financials, that's the very sector that led the rally of the past 9 months via too many junk bank stocks to list here. When the leaders fall, the followers are seldom far behind.
We suggest that in the fullness of time this will be seen as an important signal that most are currently missing.
As we noted 3 months ago on August 5th, "general markets may certainly rally higher, but we feel that increasingly even if that is the case some sectors will diverge." More than just banking stocks have bucked the market trend.
We receive no remuneration or incentive directly or indirectly in any way, shape, or form for buying or selling the stocks we do, or for mentioning any stocks or companies in this blog. If we hold existing positions we divulge the fact.
This blog is merely a diary of some of our thoughts and trades and is in no way whatsoever to be considered investment advice of any kind. Always without fail consult a competent, experienced, and honest broker or investment advisor before making any investment or speculative decisions.
To be notified when this blog is updated : Please e-mail christianguinness@hotmail.com with "Subscribe to blog" in the subject line or click here to do so automatically if your computer is configured accordingly. We have never shared our mailing list with anyone, nor will we. Please note that we only send update notifications when a trade idea is diarized or updated, not if a blog entry only contains general commentary.
The uptrend remains intact which argues for holding the full position, but we feel taking some cash off the table is prudent.
We receive no remuneration or incentive directly or indirectly in any way, shape, or form for buying or selling the stocks we do, or for mentioning any stocks or companies in this blog. If we hold existing positions we divulge the fact.
This blog is merely a diary of some of our thoughts and trades and is in no way whatsoever to be considered investment advice of any kind. Always without fail consult a competent, experienced, and honest broker or investment advisor before making any investment or speculative decisions.
To be notified when this blog is updated : Please e-mail christianguinness@hotmail.com with "Subscribe to blog" in the subject line or click here to do so automatically if your computer is configured accordingly. We have never shared our mailing list with anyone, nor will we. Please note that we only send update notifications when a trade idea is diarized or updated, not if a blog entry only contains general commentary.
Last Thursday we promised that we'd "write more tomorrow on disappearing pensions as the possible catalyst for a market crash and major U.S. Dollar rally."
We should have said "Tuesday", not "tomorrow", so today is the day.
We do not suggest that a market crash is imminent or will happen at all. Our current thinking remains as past stated.
In August we wrote that "we feel that the rally since early March, or at least the bulk of it, is over. General markets may certainly rally higher, but we feel that increasingly even if that is the case some sectors will diverge."
That's exactly what has happened. General markets have gone higher of course. As of today the DJIA is only a few hundred points higher, and the important thing to note is the bearish divergence found in an increasing number of stocks and sectors that have been lagging the broader market. For example, XLF, the financial sector ETF, is at the same level it was in August, and an increasing number of stocks have fallen below their 50-day moving averages.
At present we believe there'll be a slow back-and-forth decline in the markets over time to new lows. That decline may well have started in October.
Today we simply wish to suggest what could be the main catalyst for a crash or protracted market slide, and why it could last a decade or more.
Economic problems are many, and the "solutions" so far enacted by those in power only exacerbate and protract these problems. Most think that if a market crash happens it'll be due to the "credit crisis", something to do with banks failing. Perhaps, but it's seldom what most people think will happen that actually does happen in the markets.
First we establish the problem with a series of links. Fans of horror stories will especially enjoy the Pension Tsunami website. The gross mismangement evident in the loss of "invested" pension monies could also fit well into the True Crime genre.
Mish Shedlock has been doing an excellent job putting it into perspective :
We ignore the hype about massive amounts of money "on the sidelines" waiting to propel this bear market rally further. First, it's a false claim. Most funds are at cash levels consistent with their historical lows, and most retail investors are currently all-in and probably on margin. Further, with the "baby boomer" generation now retiring there'll be increasing amounts of money being taken out of the markets to protect the diminished wealth left in retirement funds.
Future retirees will have much less government and corporate help thus will need to save and safeguard their own money which means that retirement money will not be put into the equities markets in the first place. As the harsh reality sets in, people will realize that stock markets, real estate, and other too-good-to-be-true Ponzis, bubbles, and retirement schemes won't float them in their old age.
There will not be a bailout for Social Security.
Demographic trends further the problem, especially in Japan and the European Union. There are not enough young workers and taxpayers to fund the retiring masses. People will attempt to work longer in old age, making for greater numbers of unemployed and more competition for jobs and downward pressure on wages with the attendant deflationary economic effects.
This will all cause increasing pressure on the housing market - in increasing numbers people will be selling homes and property to downsize and make ends meet.
Pension funds, wielding hundreds of billions of dollars in the markets, will also need to withdraw investments to save what little they have left. Perhaps this will be done per well-meaning laws in response to public outcry, making things worse as all reactionary government policies do. As the market declines, the "domino effect" will be evident.
This flight to cash is the basis for our thinking that the U.S. Dollar will rally to new highs. Further, factor that while the U.S. Dollar is indeed a fiat currency under constant devaluation, its value is measured against other currencies and most rival currencies are in worse shape.
What else might happen? Will the government succeed in devaluing the currency enough to hyper-inflate away debts to citizens and foreign nations alike? Will foreign nations stand for it? Will citizens?
We receive no remuneration or incentive directly or indirectly in any way, shape, or form for buying or selling the stocks we do, or for mentioning any stocks or companies in this blog. If we hold existing positions we divulge the fact.
This blog is merely a diary of some of our thoughts and trades and is in no way whatsoever to be considered investment advice of any kind. Always without fail consult a competent, experienced, and honest broker or investment advisor before making any investment or speculative decisions.
To be notified when this blog is updated : Please e-mail christianguinness@hotmail.com with "Subscribe to blog" in the subject line or click here to do so automatically if your computer is configured accordingly. We have never shared our mailing list with anyone, nor will we. Please note that we only send update notifications when a trade idea is diarized or updated, not if a blog entry only contains general commentary.
"A false recovery is under way. I am reminded of the outlook in 1930, when the experts were certain that the worst of the Depression was over and that recovery was just around the corner. The economy and stock market seemed to be recovering, and there was optimism that the recession, like many of those before it, would be over in a year or less. Instead, the interventionist policies of Hoover and Roosevelt caused the Depression to worsen, and the Dow Jones industrial average did not recover to 1929 levels until 1954."
We receive no remuneration or incentive directly or indirectly in any way, shape, or form for buying or selling the stocks we do, or for mentioning any stocks or companies in this blog. If we hold existing positions we divulge the fact.
This blog is merely a diary of some of our thoughts and trades and is in no way whatsoever to be considered investment advice of any kind. Always without fail consult a competent, experienced, and honest broker or investment advisor before making any investment or speculative decisions.
To be notified when this blog is updated : Please e-mail christianguinness@hotmail.com with "Subscribe to blog" in the subject line or click here to do so automatically if your computer is configured accordingly. We have never shared our mailing list with anyone, nor will we. Please note that we only send update notifications when a trade idea is diarized or updated, not if a blog entry only contains general commentary.