Gold And Silver Charts
Below are charts of gold (represented by GLD) and silver (represented by SLV), showing a 4-year declining wedge pattern in each.


From Investopedia:
The wedge chart pattern signals a reverse of the trend that is currently formed within the wedge itself. Wedges are similar in construction to a symmetrical triangle in that there are two trendlines - support and resistance - which band the price of a security.
The wedge pattern differs in that it is generally a longer-term pattern, usually lasting three to six months. It also has converging trendlines that slant in an either upward or downward direction, which differs from the more uniform trendlines of triangles.
There are two main types of wedges – falling and rising – which differ on the overall slant of the pattern. A falling wedge slopes downward, while a rising wedge slants upward.
Falling Wedge The falling wedge is a generally bullish pattern signaling that one will likely see the price break upwards through the wedge and move into an uptrend. The trendlines of this pattern converge, with both being slanted in a downward direction as the price is trading in a downtrend.
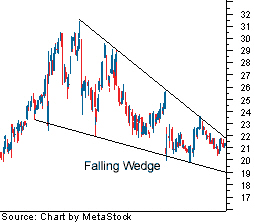 |
| Figure 1: Falling wedge pattern |
Another thing to look at in the falling wedge is that the upper (or resistance) trendline should have a sharper slope than the support level in the wedge construction. When the lower (or support) trendline is clearly flatter as the pattern forms, it signals that selling pressure is waning, as sellers have trouble pushing the price down further each time the security is under pressure.
The price movement in the wedge should at minimum test both the support trendline and the resistance trendline twice during the life of the wedge. The more times it tests each level, especially on the resistance end, the higher quality the wedge pattern is thought to be.
The buy signal is formed when the price breaks through the upper resistance line. This breakout move should be on heavier volume, but due to the longer-term nature of this pattern, it's important that the price has successive closes above the resistance line.
We receive no remuneration or incentive directly or indirectly in any way, shape, or form for buying or selling the positions we do, or for mentioning any positions or publicly traded companies in this blog. If we hold existing positions we divulge the fact. This blog is merely a diary of some of our thoughts and trades and is in no way whatsoever to be considered investment advice of any kind. Always without fail consult a competent, experienced, and honest broker or investment advisor before making any investment or speculative decisions.
Please presume that we, she, he, I, it, them, they, us and you are purely fictional characters and that everything written in this blog is satire intended for comedic amusement only, and not to be taken seriously in any way. Just like "real" analyst proclamations. Thank you.
To be notified when this blog is updated : Please e-mail christianguinness@hotmail.com with "Subscribe to blog" in the subject line or click here to do so automatically if your computer is configured accordingly. We have never shared our mailing list with anyone, nor will we. Please note that we only send update notifications when a trade idea is diarized or updated materially, not if a blog entry only contains general commentary.
posted by C. Guinness @ 12:54 AM
![]()
![]()
<< Home